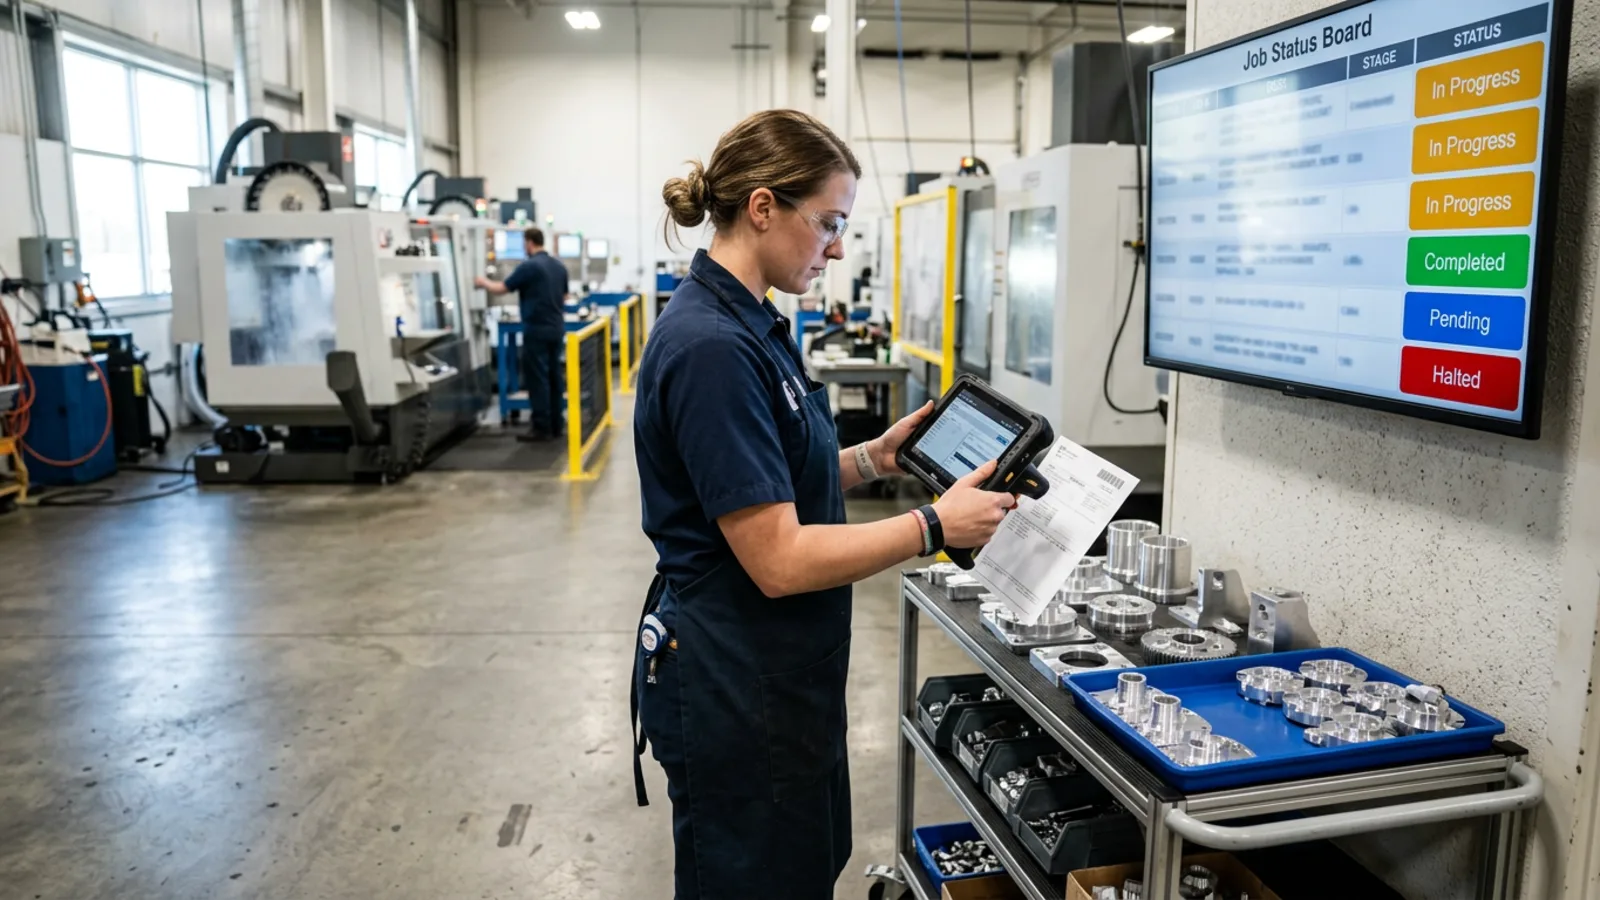
You can get reliable shop-floor visibility without buying a full ERP. A focused custom app can connect each job to its materials, operations, costs, and current status, giving the team one place to answer where the work is, what it is costing, and whether it will ship on time.
The value is not a prettier production board. It is a record that changes as the work changes.
A job traveler should not disappear into the shop
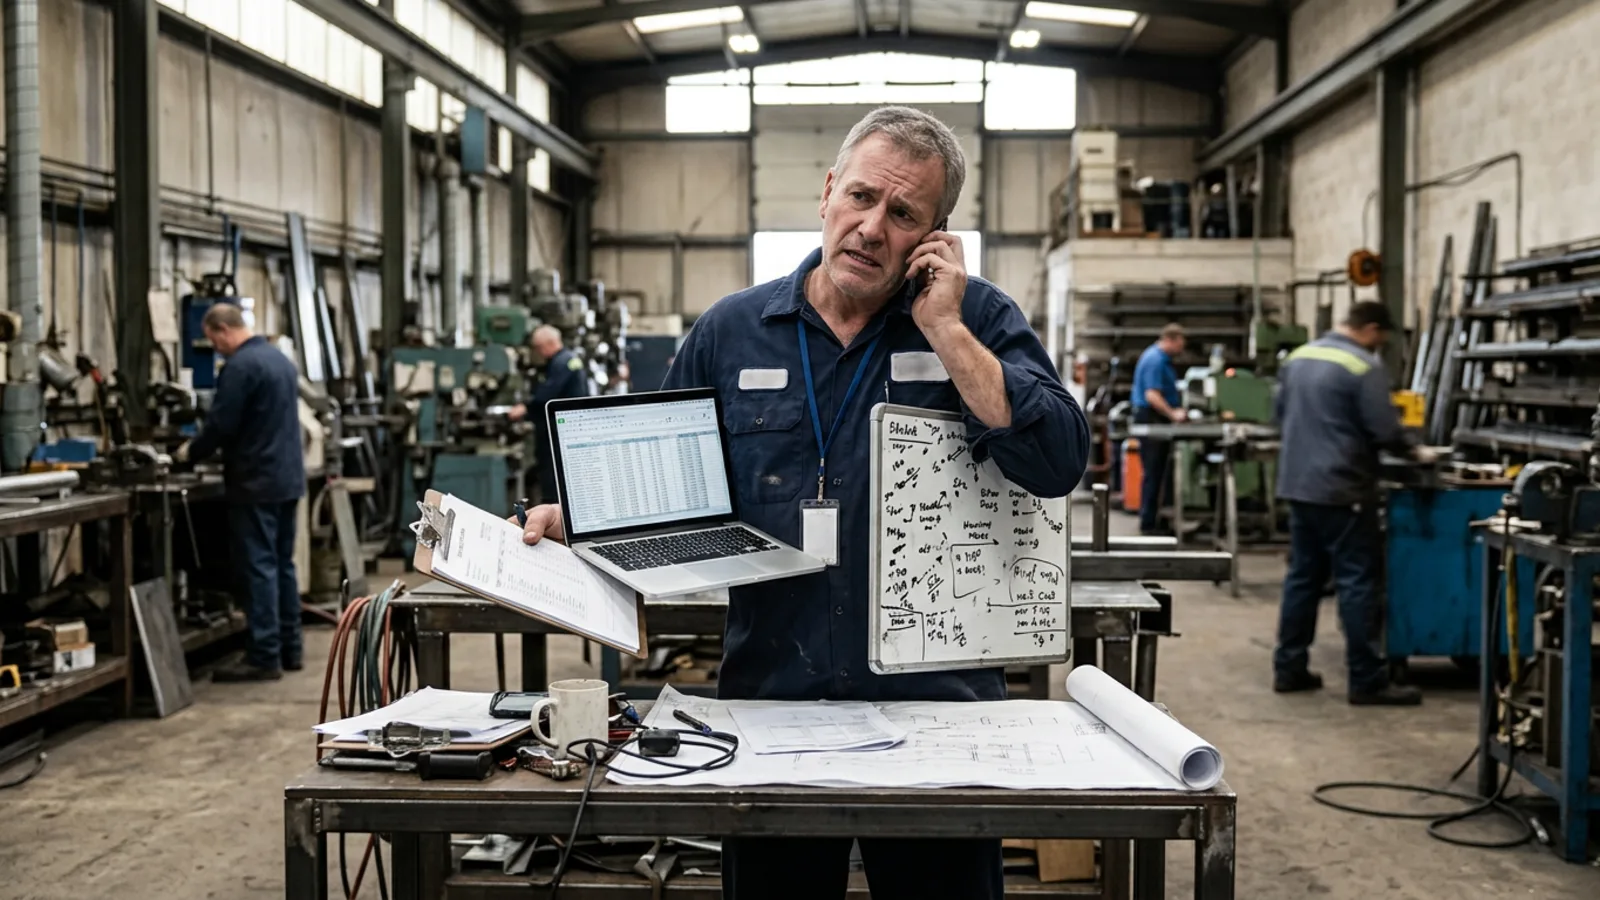
Job 4521 starts with an approved quote and a promised date. Planning releases the traveler. Material moves to cutting. The first operation finishes, but the paper traveler waits on a cart. The schedule still says the job is in cutting. Sales tells the customer everything is on track because no one has reported a problem.
At inspection, the team finds a dimensional issue. Two parts need rework. The note goes on paper, the cost goes nowhere, and the promise date becomes a guess.
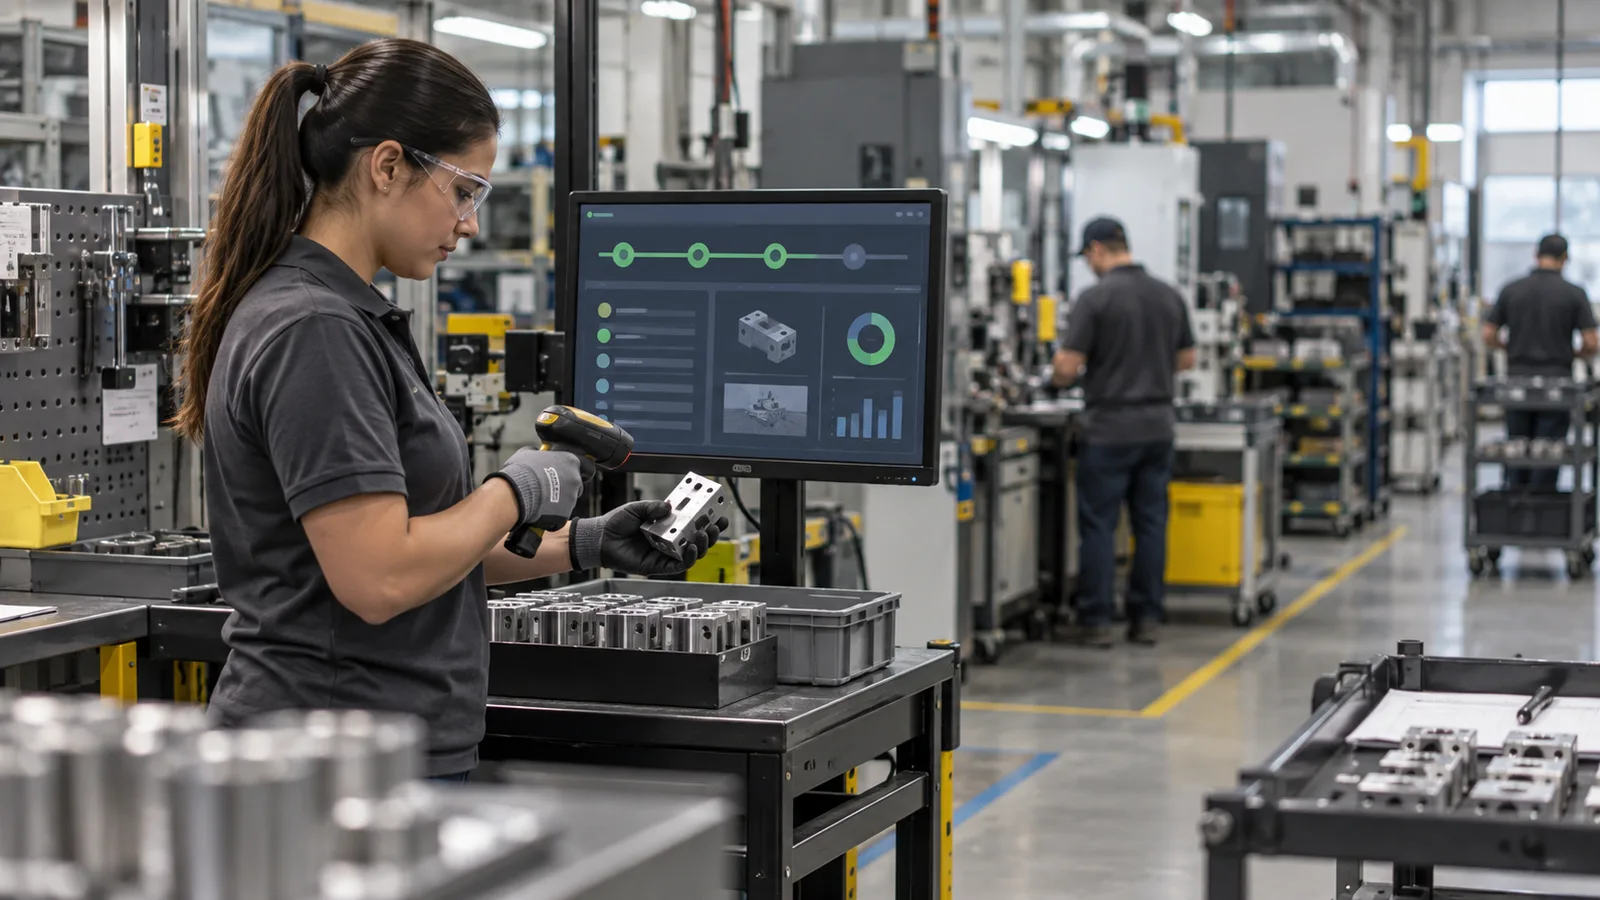
A visible system records each transition where it occurs. The operator does not write a status in one place and ask someone else to update another. Starting, pausing, completing, scrapping, and moving material are the events that build the current picture.
Kyo’s article on gathering real-time production statistics explains why the useful report begins with reliable activity capture.
Can the shop answer three basic questions?
Every production system should answer:
Where is the job? Show the current operation, work center, queue position, and blocker.
What is it costing? Connect labor, material, outside services, scrap, and rework to the job.
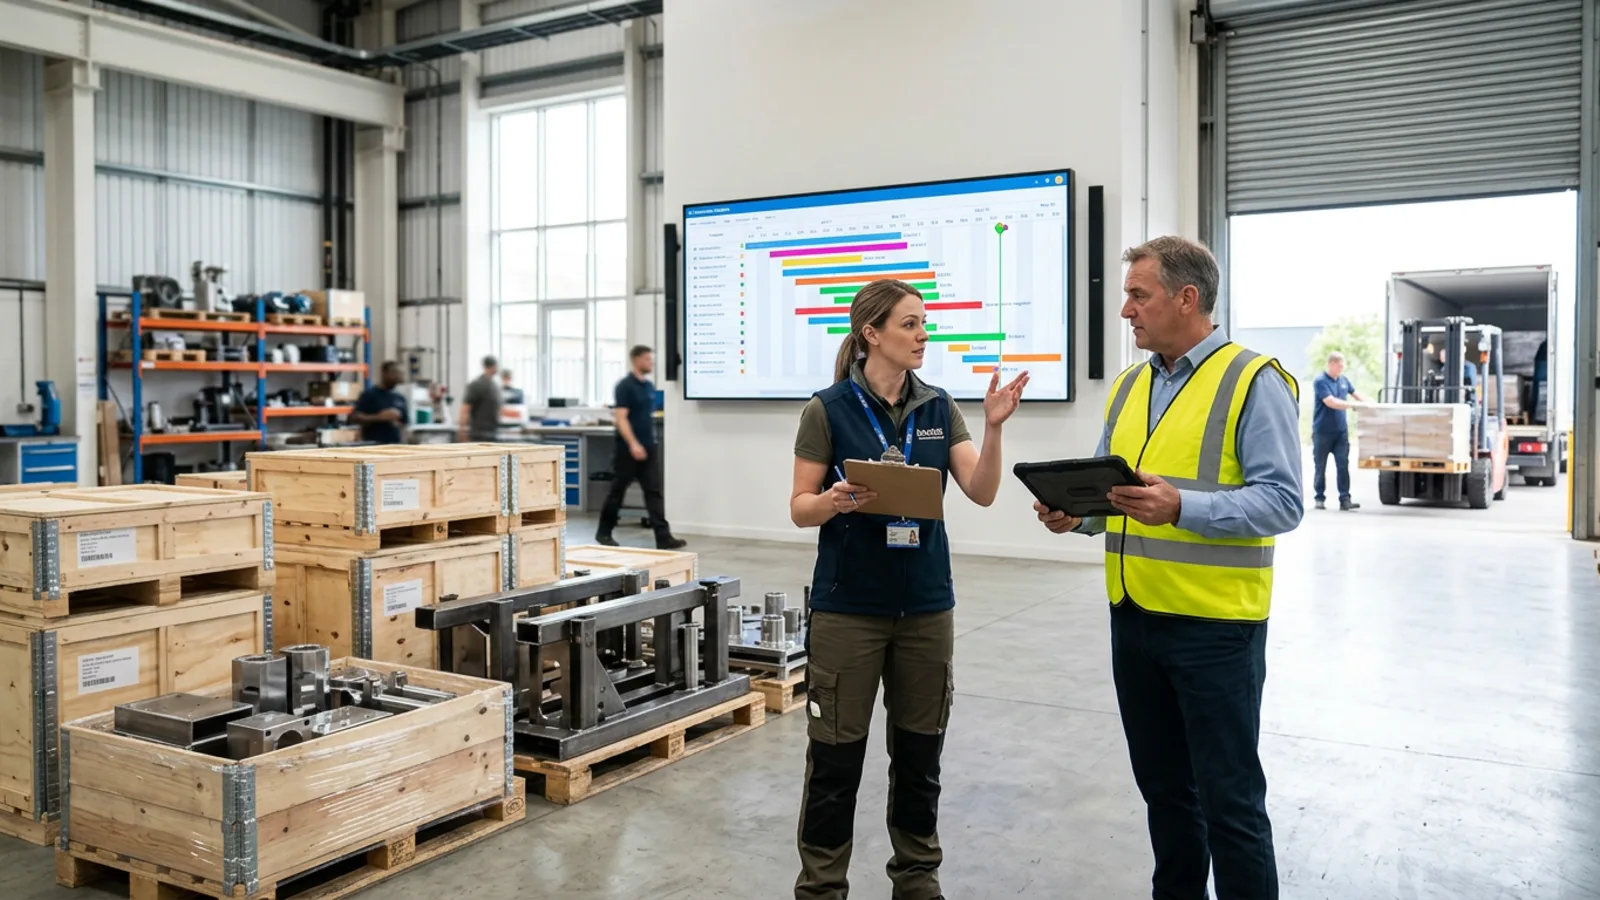
Will it ship on time? Compare remaining work, required material, capacity, and the promise date.
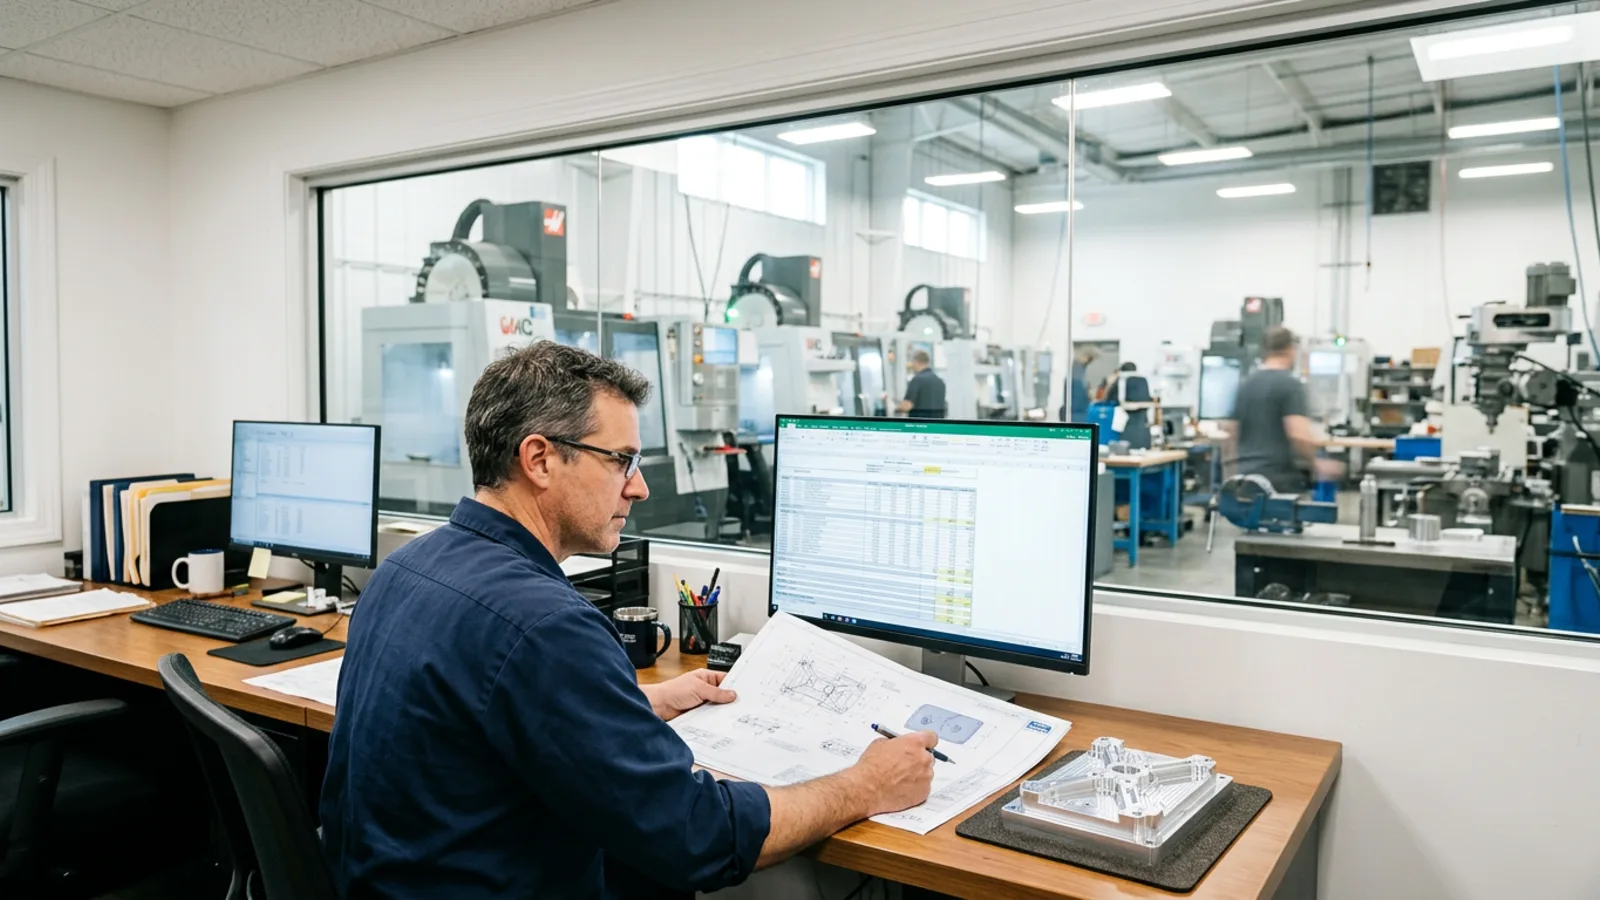
Spreadsheets often answer one question at a time. A schedule may show dates but not material shortages. An inventory file may show quantity but not what is reserved. A costing sheet may be complete only after the job closes.
Visibility comes from relationships. Job 4521 should point to its operations, material demand, actual issues, quality results, and shipment. Each screen can stay simple because the records underneath are connected.
What does one source of truth look like?
Quote becomes job
↓
Job creates operations and material demand
↓
Shop activity updates status and actual cost
↓
Exceptions appear before the promise is missed
↓
Shipment closes the operational record
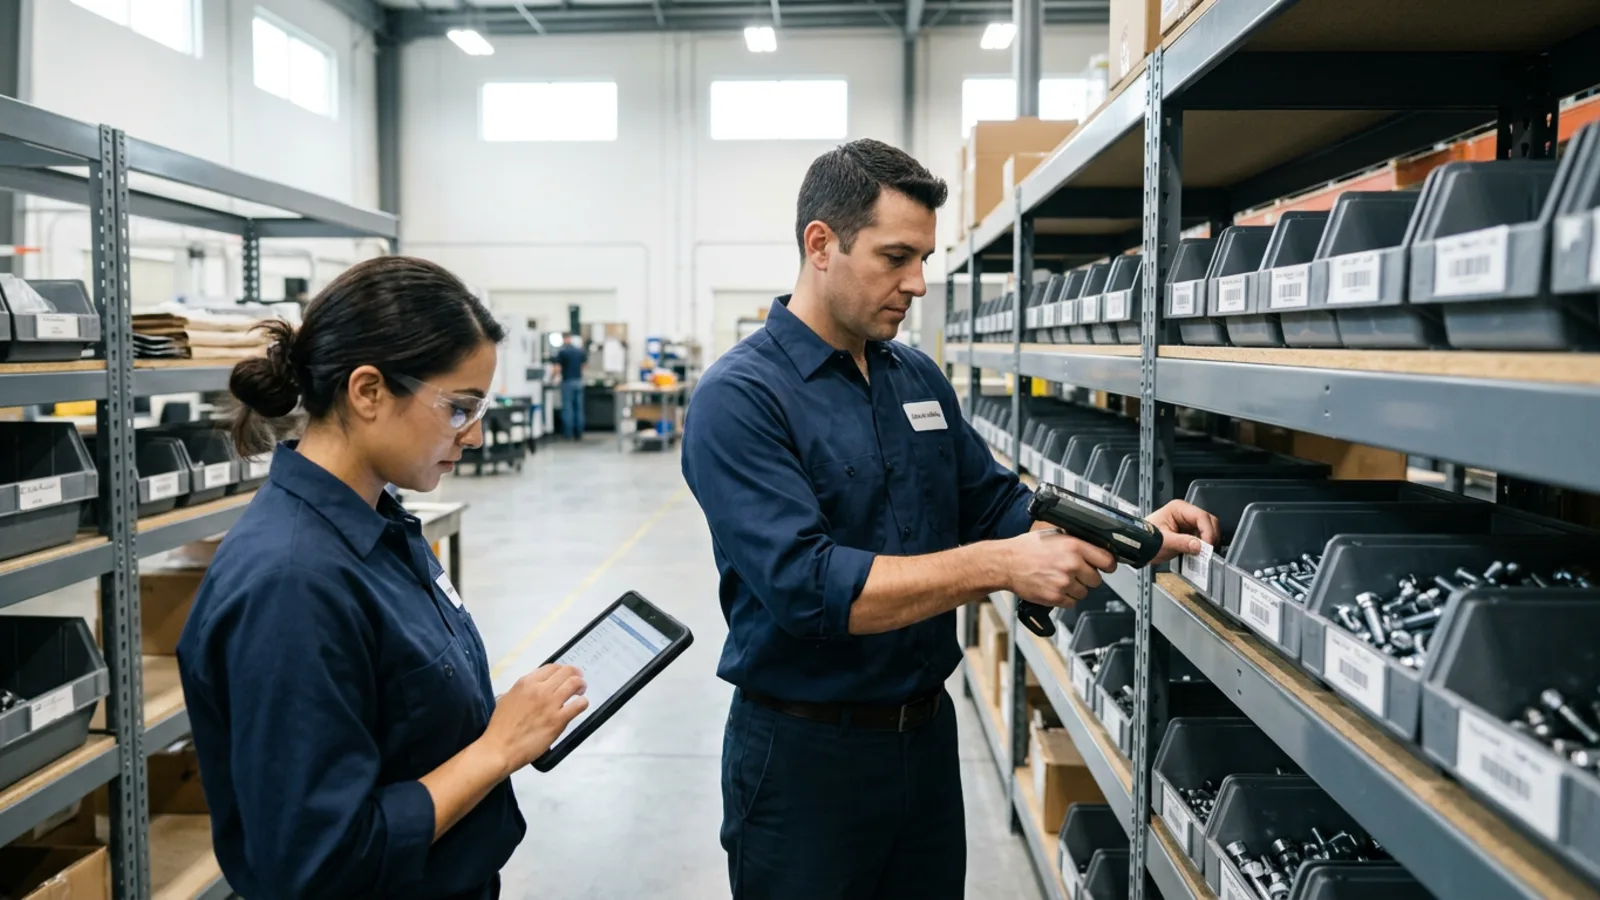
Materials belong in that flow. When receiving records a delivery, available inventory changes. When a job pulls material, on-hand and job cost change together. When unused material returns, both records are corrected through a controlled transaction.
Kyo covers that pattern in real-time inventory tracking. The point is not to make the number move faster. It is to make the movement explainable.
Build the screens around work, not around tables
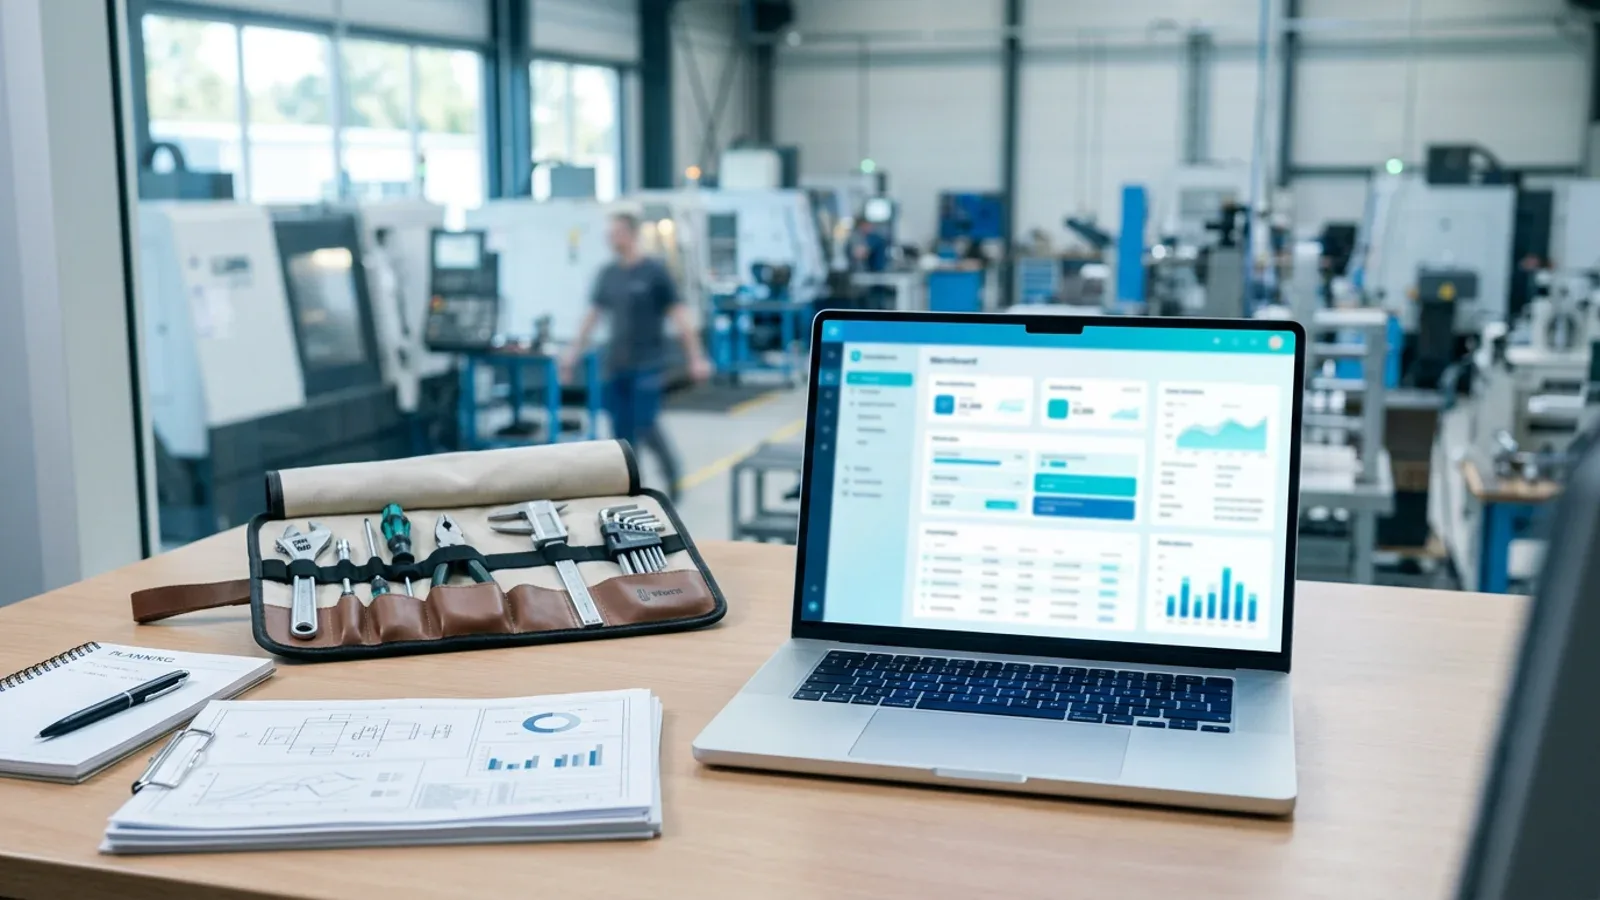
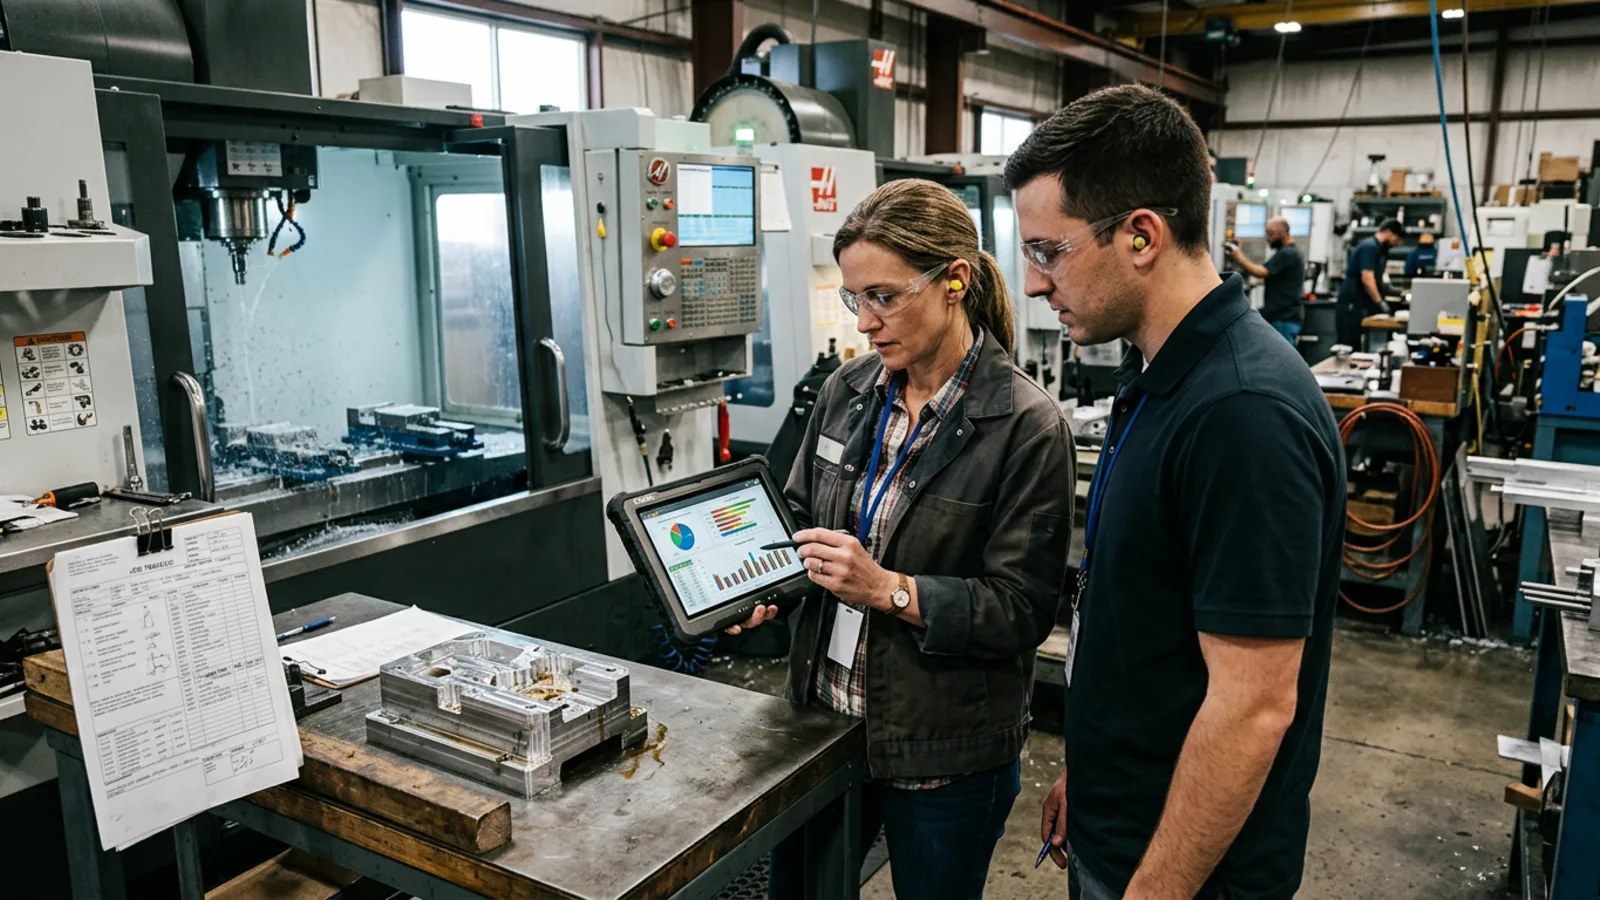
An operator needs a short queue, clear instructions, required documents, and a fast way to report the result. A planner needs capacity, shortages, blocked work, and late-risk indicators. Sales needs a customer-facing status without access to internal production details.
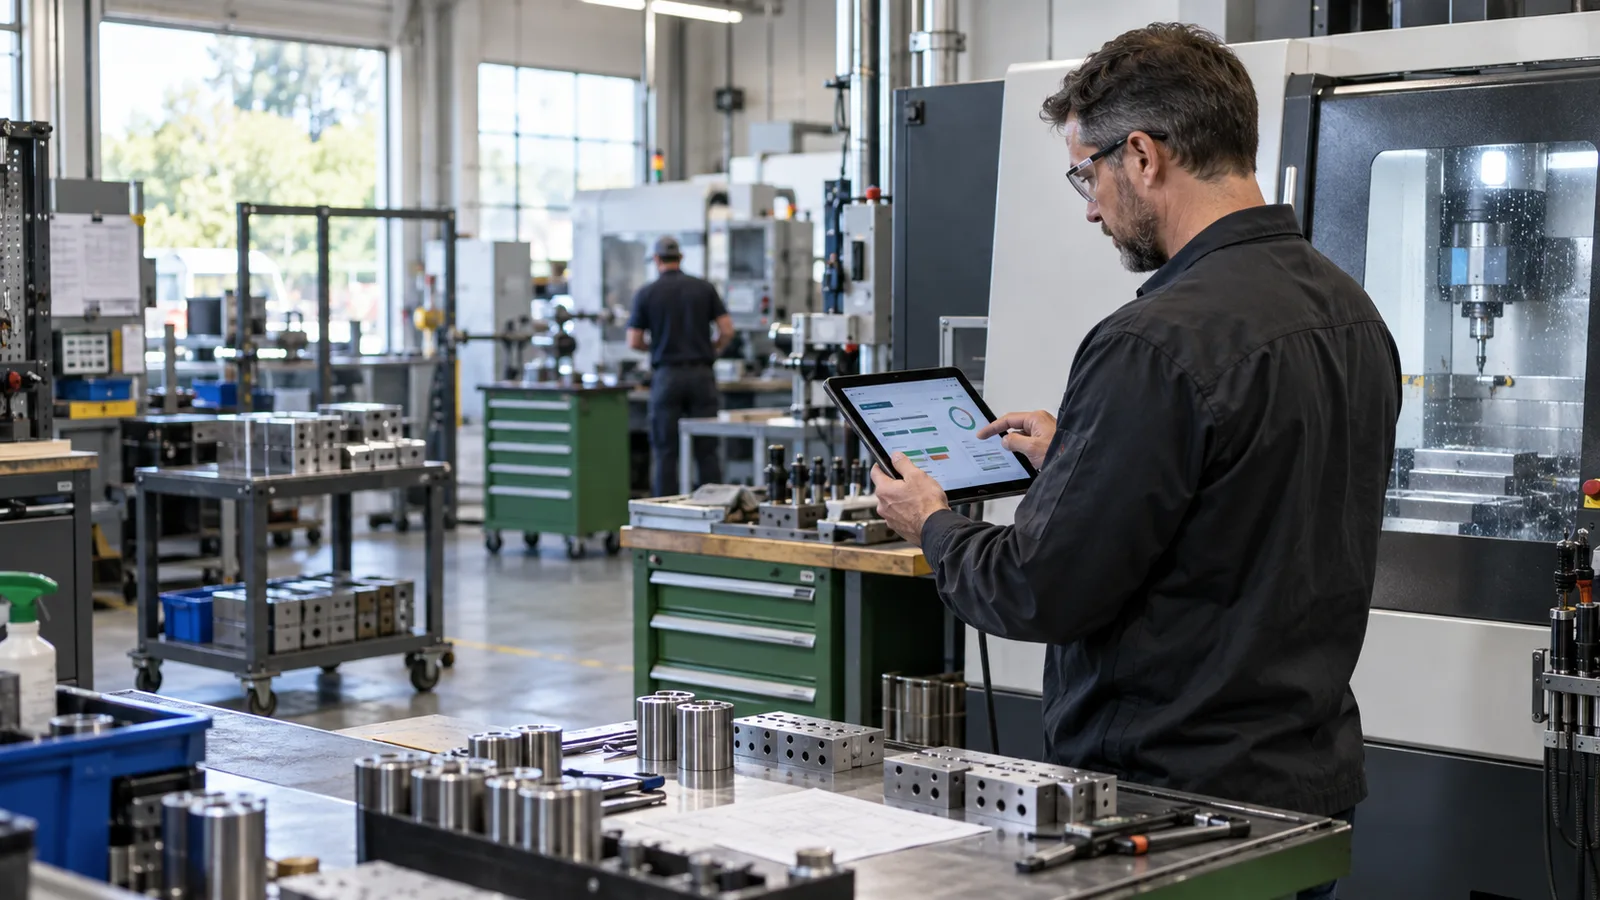
One application can provide those different views while keeping one underlying job record. That is more useful than forcing every role into the same crowded dashboard.
The workflow also has to allow real exceptions. A job may skip an operation, return for rework, split into partial shipments, or wait on customer approval. Kyo’s article on customizing production steps and requirements shows why the system must reflect how the shop actually routes work.
Start with one value stream
Do not begin by digitizing every form in the building. Pick one product family or work center where visibility is poor and the business effect is clear. Define the status events, material transactions, and exceptions that matter. Pilot them with the people doing the work.
Measure practical outcomes: fewer status-chasing messages, earlier shortage detection, more accurate job cost, and fewer late surprises. Small production issues become large delays when the system hides them until the schedule is already broken.
Frequently asked questions
Do we need an ERP to track production in real time?
No. A focused application can capture production events and report current status. The right architecture depends on volume, integrations, devices, and availability requirements.
How does a custom app know where a job is?
Operators or connected equipment record defined events such as start, pause, complete, move, inspect, or ship. Those events update the job’s current state.
Can the app track materials with the job?
Yes. Receipts, reservations, pulls, returns, and scrap can be modeled as transactions tied to the job and inventory item.
What should we pilot first?
Choose a workflow with frequent status questions or costly late surprises, and include normal exceptions rather than testing only the ideal path.
Where to start
Kyo Logic builds custom Claris/FileMaker and manufacturing software for New England companies. We design shop-floor tools around the decisions each role makes, then connect those views to one controlled operational record.
If your team cannot answer where a job is without walking the floor, talk with Kyo Logic about a focused visibility pilot.